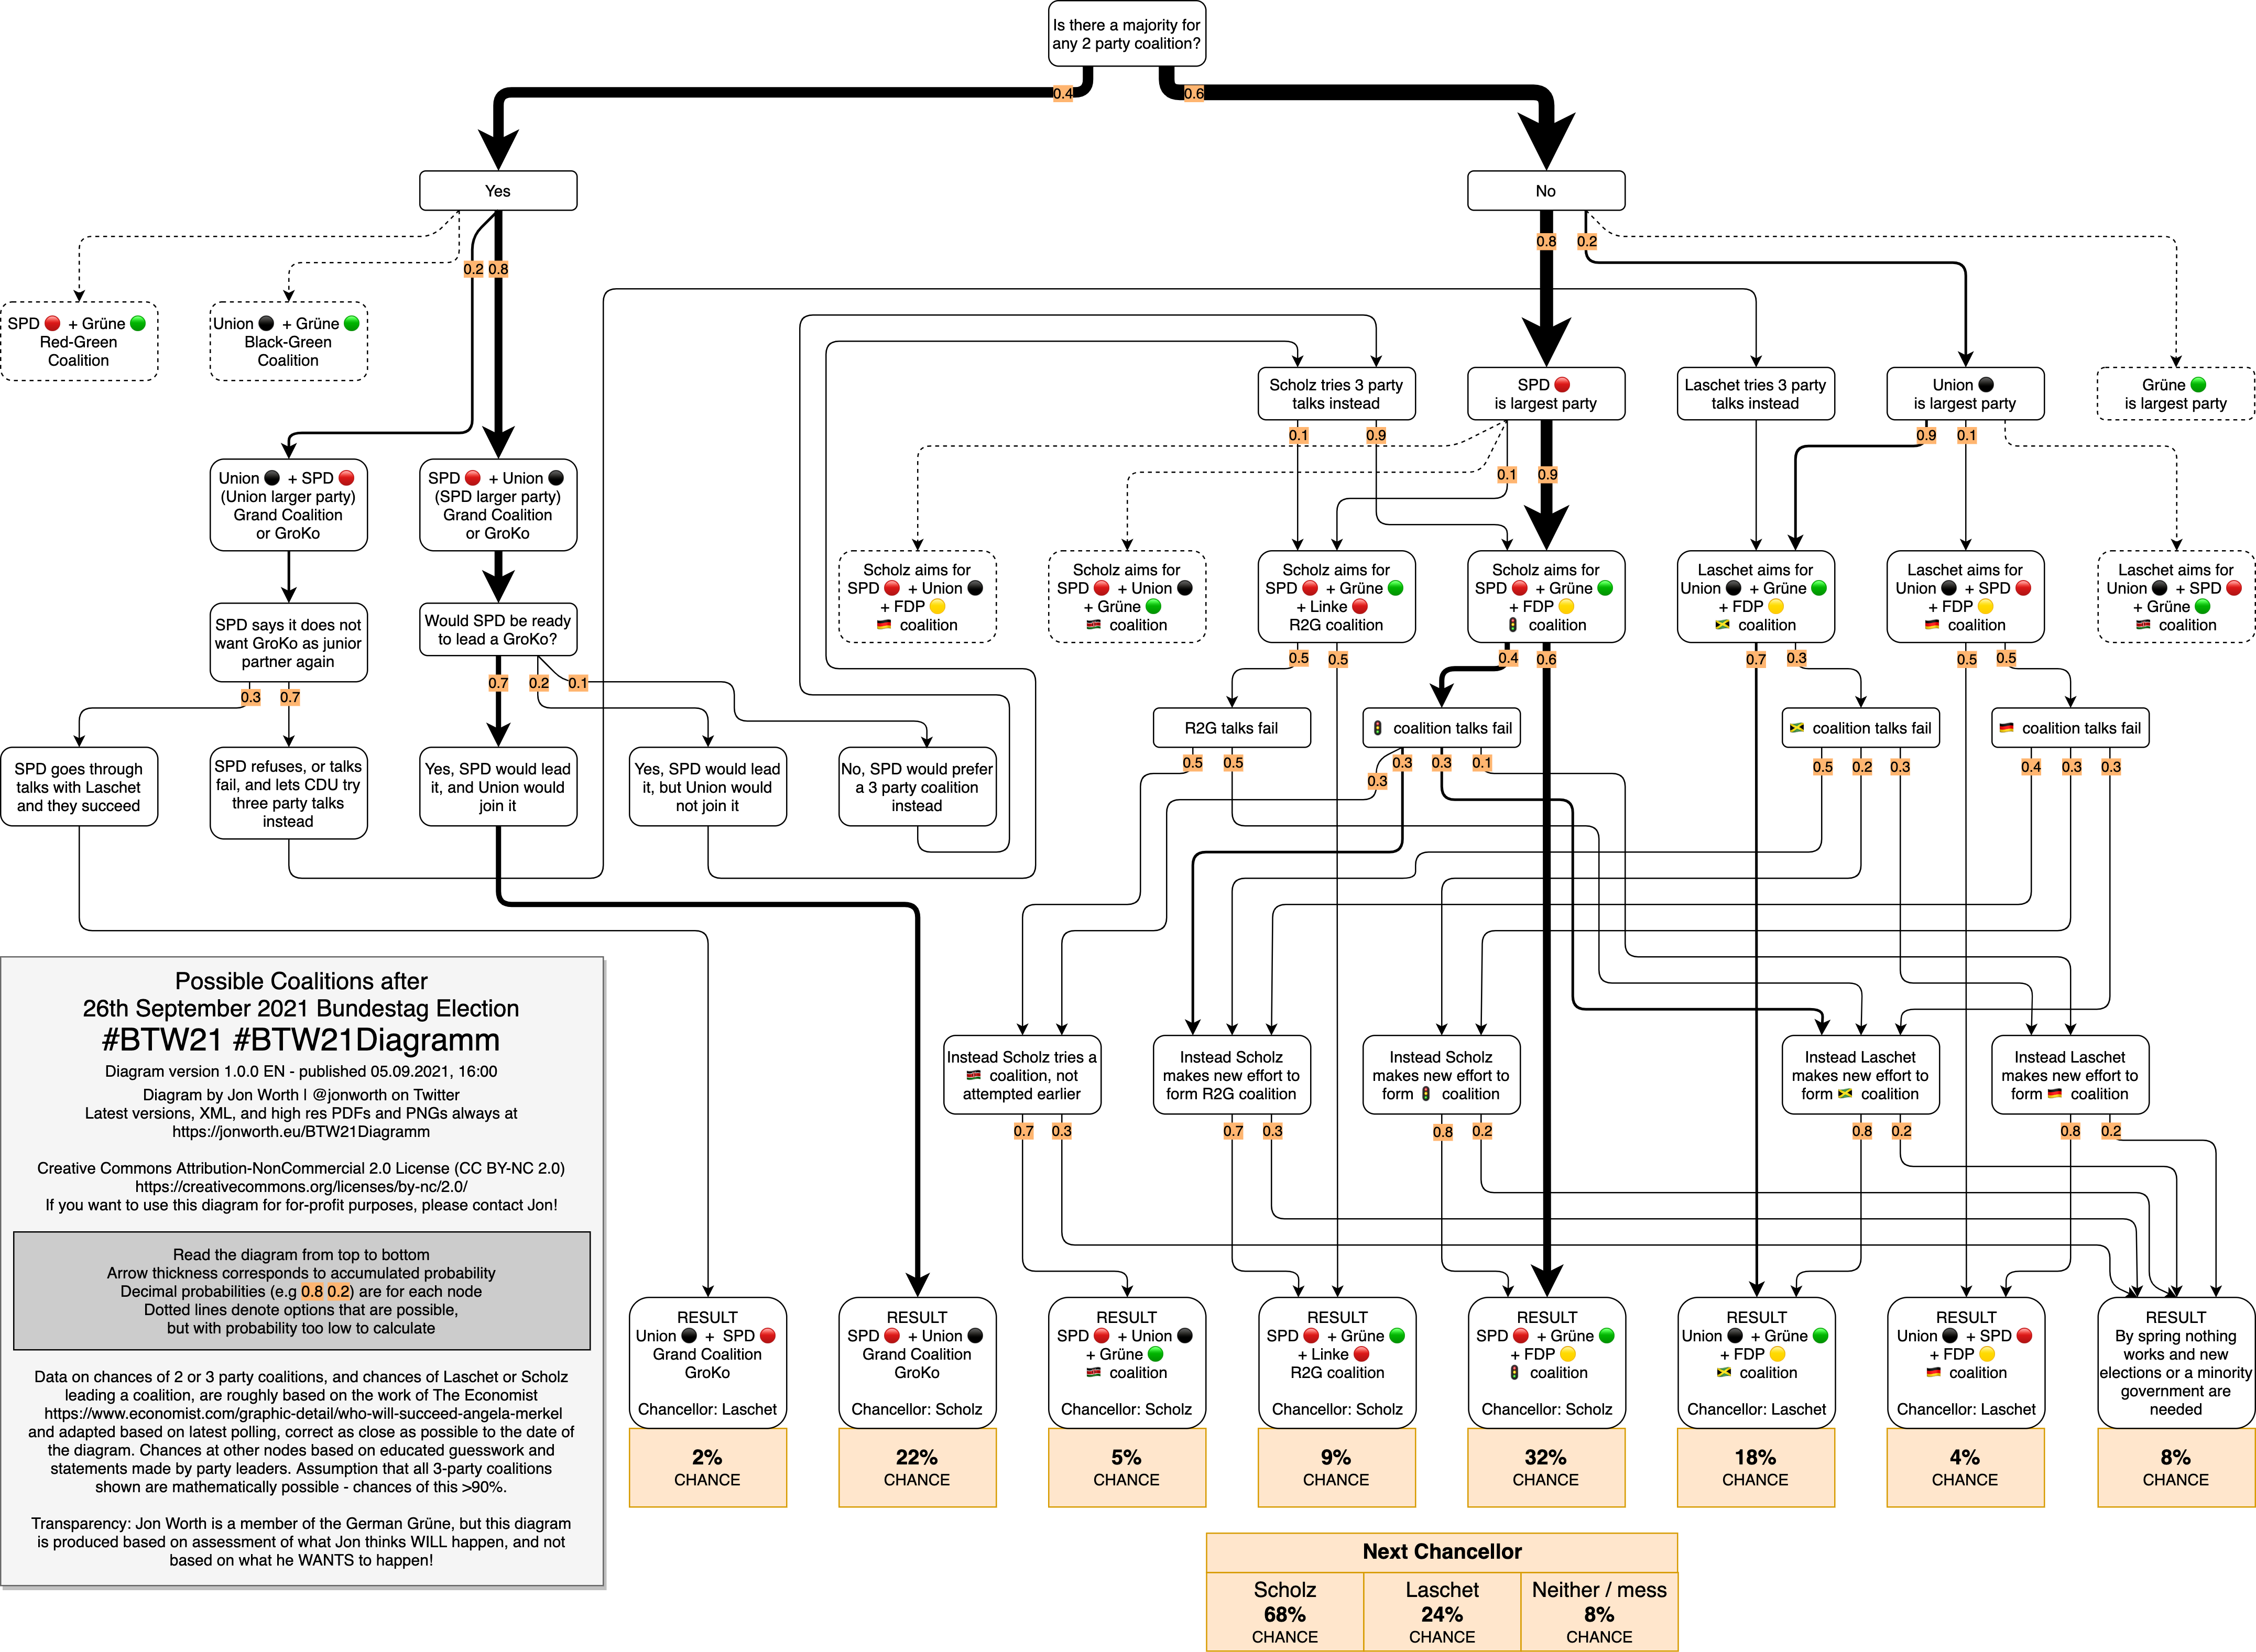
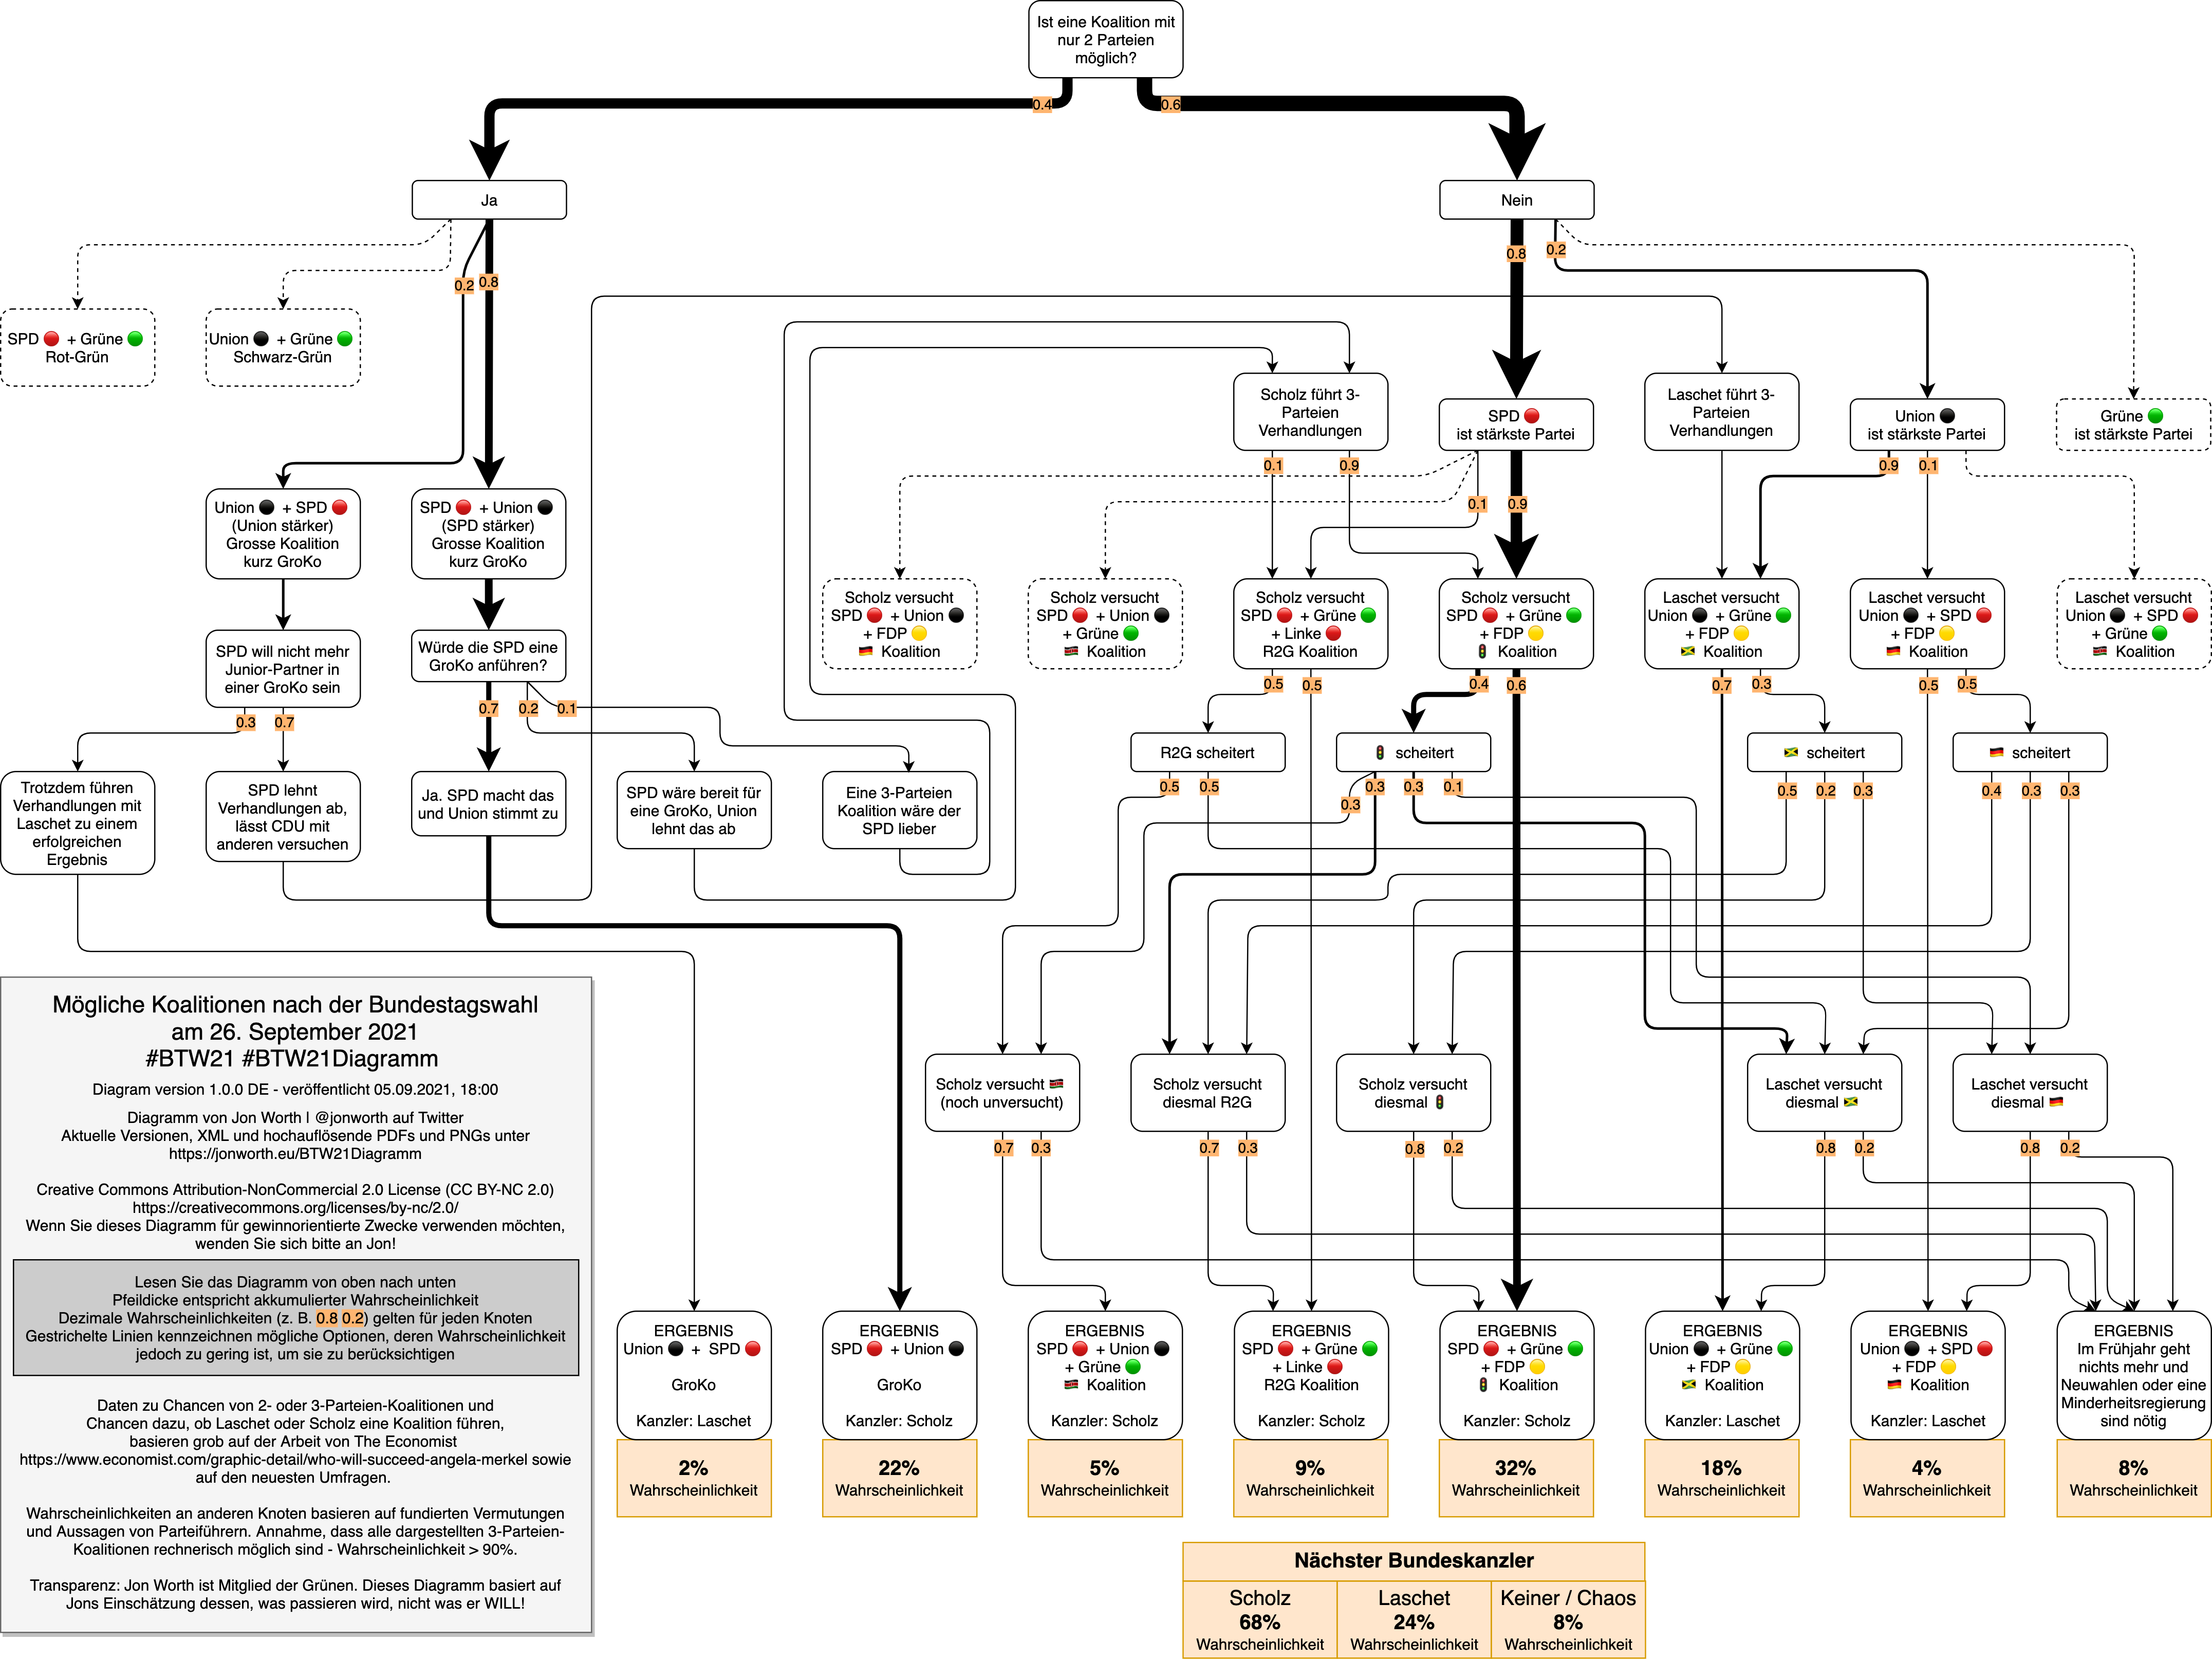
#BTW21Diagramm Possible Coalitions after the 26th September 2021 Bundestag Election / Mögliche Koalitionen nach der Bundestagswahl am 26. September 2021

High resolution PDF and PNG files, the draw.io XML and the .ods files of the workings are all available here!
Hochauflösende PDF- und PNG-Dateien, draw.io-XML und die .ods-Dateien sind hier verfügbar!
Version 1.0.0 EN – 05.09.2021, 18:00
The first version of the new series! Based on the polling and modelling correct as of 5th September 2021. Click to enlarge.

Version 1.0.0 DE – 05.09.2021, 18:00
Die erste Version der neuen Serie! Basierend auf den Umfragen und Modellierungen, Stand 5. September 2021. Klicken um zu vergrößern.

You can find all my previous Brexit Diagrams here.
Great work, super interesting! I guess the probabilities you assign are your “expert guesses” or do you have any other sources you base these numbers on?
I’m surprised you have such a low probability that the SPD would choose a 3-party coalition over GroKo. Given the SPD’s discontent at joining the current GroKo, isn’t there a chance they’ll go for visible change, even at the expense of trickier coalition negotiations? I would give that a 1 in 4 chance.
Kleine Fehleranmerkung: Beide Diagramme verlinken auf die deutschsprachige Hires-Version
Danke! Gelöst.
That’s amazingly detailed work! Is the Red–Green scenario really a near zero probability outcome? Isn’t their combined share getting quite close to the threshold according to the most recent polls?